
 EN
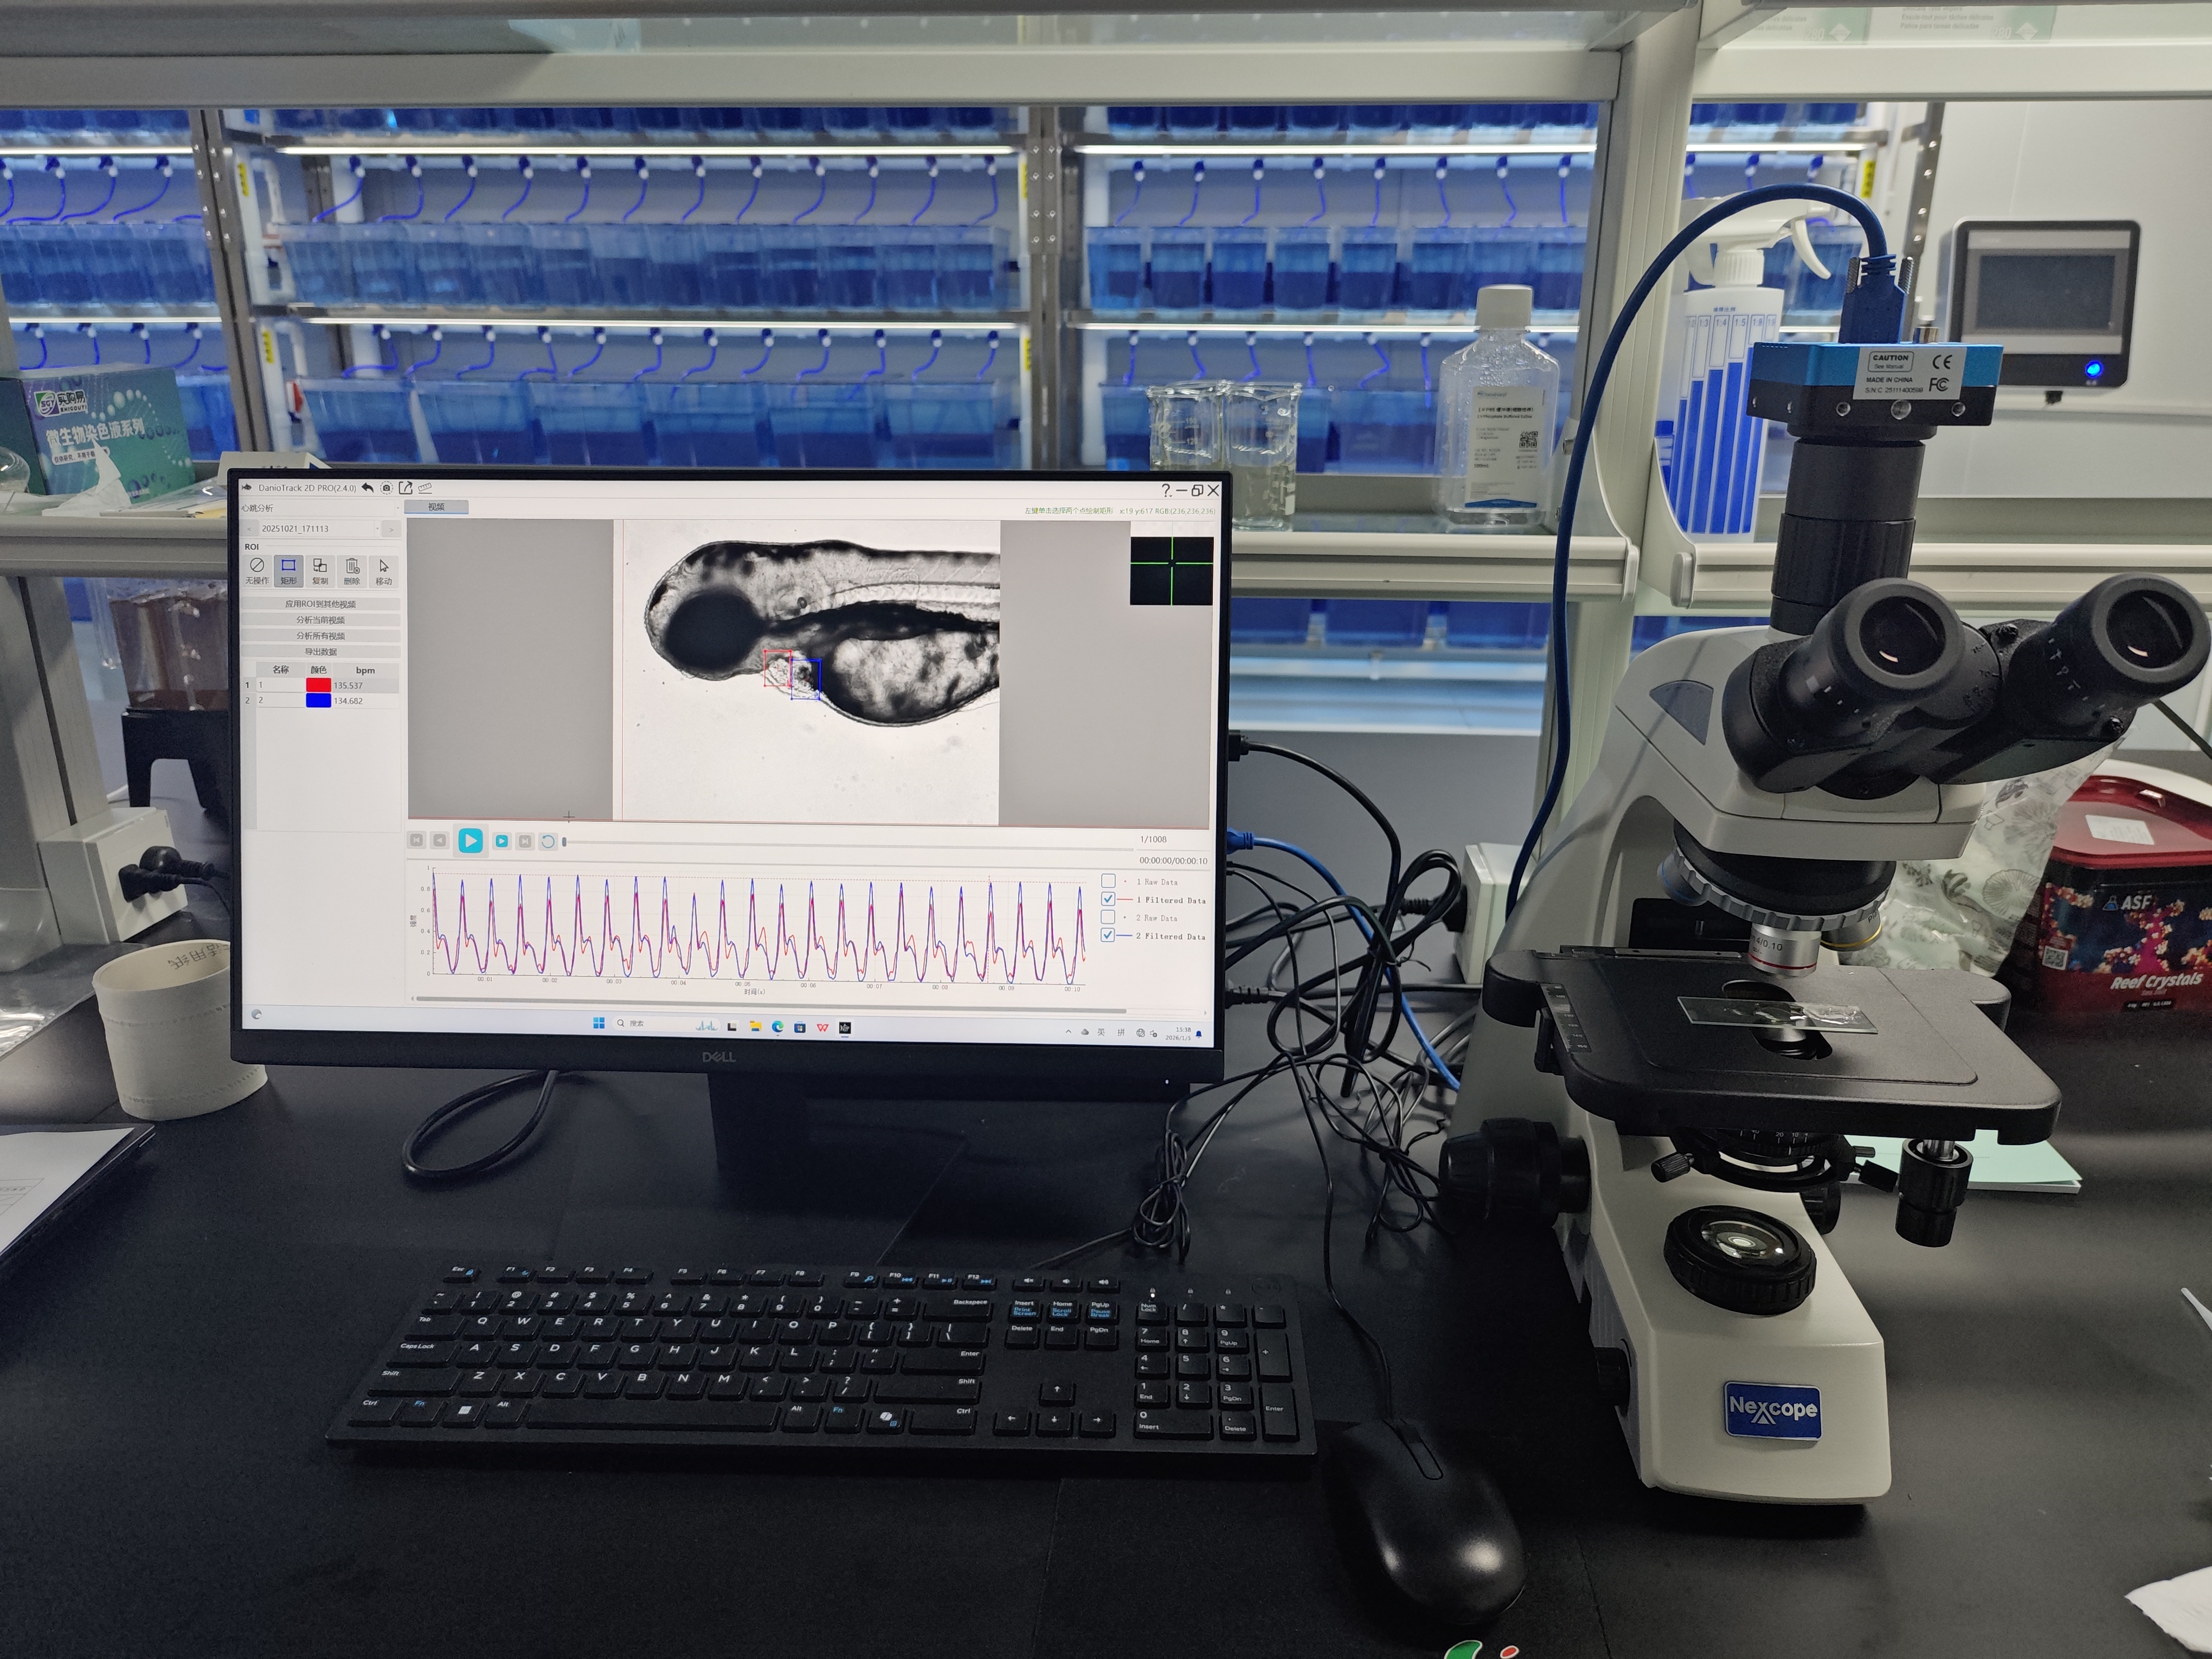
Why measuring vessel diameter in a moving embryo is not trivial
Zebrafish embryos are a favorite for cardiovascular studies because their transparency lets researchers watch blood vessels form and function in real time. That optical window is a huge advantage, but it comes with a catch. The same heart that makes the model useful also keeps the vessels moving. A single heartbeat can shift a vessel edge by several pixels, and that motion can easily be mistaken for a change in diameter. A zebrafish blood flow analysis system has to separate true vessel geometry from cardiac motion, respiratory movement, and occasional twitches.
The problem is not just motion. Vessel diameter in a larva can be only a few micrometers. At that scale, optical resolution, pixel size, and focusing all matter. A system that looks great on a static calibration target may struggle once the sample is alive and pumping.
Imaging modality decides what the system can actually see
Most diameter measurements start with a microscope. Brightfield imaging is simple and needs no labeling, but contrast between the vessel wall and surrounding tissue can be weak. Fluorescence imaging solves that by using transgenic lines that express a fluorescent protein in endothelial cells. The vessel boundary becomes a bright line against a dark background, which makes edge detection much more reliable.
Confocal and light-sheet systems add optical sectioning. That helps when vessels overlap or when the structure of interest sits deeper in the tissue. The tradeoff is speed. Point-scanning confocal can be too slow for capturing rapid diameter changes. Spinning disk or light-sheet setups often work better for dynamic measurements.
Resolution is the hard limit. A typical high-numerical-aperture objective might resolve details down to a fraction of a micrometer, but the detector pixel size and the optics together determine the smallest measurable change. If the vessel is only a few pixels wide, subpixel algorithms are needed to get meaningful numbers.
Calibration turns pixels into micrometers
A diameter value in pixels is useless without a scale. Calibration is the step that converts those pixels into micrometers. A stage micrometer or a hemocytometer slide is the classic tool. A known distance is imaged under the same objective and camera settings used for the experiment. The software then calculates micrometers per pixel.
-
Capture an image of the calibration target at the same magnification.
-
Measure a known distance in pixels.
-
Divide the known distance by the pixel count to get the scale.
-
Apply that scale to every vessel measurement.
Calibration sounds trivial, but it is easy to get wrong. Changing the objective, the camera binning, or the zoom setting invalidates the old scale. A system that stores calibration profiles for each configuration reduces that risk. Some advanced platforms also use fluorescent microspheres of known diameter to check the scale in three dimensions.
Edge detection and profile analysis find the vessel wall
Once the image is calibrated, the software has to locate the vessel edges. Several methods are common. The simplest is a threshold: any pixel brighter than a set value is considered vessel, and the diameter is the distance between the outer edges of that region. Thresholding is fast but sensitive to illumination changes and noise.
A more robust approach uses intensity profiles. A line is drawn perpendicular to the vessel, and the pixel intensities along that line are plotted. The vessel edges appear as peaks or valleys, depending on the labeling. The full width at half maximum, often shortened to FWHM, is a standard way to define the diameter from that profile. FWHM is less sensitive to overall brightness changes than a fixed threshold, which makes it useful for live imaging.
Subpixel edge detection goes a step further. Instead of treating a pixel as the smallest unit, the algorithm fits a curve to the intensity profile and finds the edge location with subpixel precision. That can improve repeatability when the vessel is only a few pixels across.
Tracking diameter through the cardiac cycle
A resting vessel still moves. The heartbeat pushes blood through the aorta and other major vessels, causing them to expand and contract with each pulse. Measuring a single frame gives a snapshot, not a true diameter. A system that claims to measure vessel diameter has to address the cardiac cycle.
High-speed cameras help. Frame rates above 100 frames per second can capture several points across a heartbeat. Some systems use retrospective gating, where the software sorts frames by their phase in the cardiac cycle. Others use prospective triggering, where image acquisition is synchronized to the heartbeat. Both approaches reduce motion blur and let the user report systolic and diastolic diameters separately.
| Method | Typical precision | Motion sensitivity | Best for |
|---|---|---|---|
| Manual tracing | Moderate | High | Static or fixed samples |
| Thresholding | Moderate | Moderate | High-contrast fluorescence |
| FWHM profile | Good | Low to moderate | Live imaging with intensity gradients |
| Subpixel edge fitting | High | Low | Small vessels, dynamic studies |
A field example where motion artifact nearly derailed a study
A cardiovascular research group at a university in southern China was using an automated blood flow analysis system to measure dorsal aorta diameter in zebrafish embryos. The first datasets showed large fluctuations that did not match the expected pharmacological response. The team suspected a biological effect, but the pattern was too erratic.
A closer look at the raw video revealed the problem. The vessel edge was moving with each heartbeat, and the tracking algorithm was locking onto different points along the edge from frame to frame. The measured diameter was jumping by more than the true change. The fix involved increasing the frame rate, adding a retrospective gating step, and switching from a simple threshold to an intensity profile method. The next round of data showed a clean, interpretable response. The biology had been fine all along. The measurement had not.
That kind of issue is not rare. Motion artifact is one of the most common reasons a diameter measurement looks noisy. Good systems offer tools to handle it, but the user still has to recognize the problem.
What a system can and cannot promise
No imaging system can measure vessel diameter perfectly. Optical resolution sets a floor. Anesthesia can alter vessel tone. Deep vessels scatter light and blur edges. Very small capillaries may be below the practical limit of a given objective. A system that reports a number without an uncertainty estimate is hiding something.
The practical goal is repeatability. If the same vessel measured twice gives the same value within a known tolerance, the system is useful. If the value changes when the frame rate changes, the measurement is not trustworthy.
Hunter Lab (Hunter) builds zebrafish laboratory equipment with attention to the optical and mechanical details that affect diameter measurement. The manufacturing and quality control side supports the stability that high-speed imaging and subpixel analysis require. For labs that need to compare vessel diameters across treatments or across time, that stability is what makes the data worth analyzing.








