
 EN
Why a Snapshot Dose Curve Rarely Tells the Full Story
Zebrafish toxicological exposure systems look simple on paper: put fish or embryos in water, add a test compound, and record what happens. In practice, the water is not a static box. Compounds can adsorb to tubing, volatilize, degrade under light, or bind to organic matter. Oxygen can sag. pH can drift. Ammonia can creep up as animals metabolize. A dose curve built from a few grab samples can miss all of it. Real-time monitoring matters because toxicology is not only about the nominal concentration in a beaker. It is about the actual exposure animals experience over time. If exposure changes between sampling points, the biology may respond to a condition that never appears in the final dataset.
What Real-Time Monitoring Actually Captures in a Fish Exposure System
A well-instrumented zebrafish toxicological exposure platform can track temperature, dissolved oxygen, pH, conductivity, and ammonia. Some setups also follow flow rate, light cycle, and behavioral endpoints. The value is not just more data. It is context. A spike in ammonia during feeding can explain a sudden change in respiration or locomotion. A slow pH drop can alter the bioavailability of a metal or weak acid. Real-time monitoring turns these from invisible confounders into timestamped events. A daily average may hide a two-hour oxygen crash that stressed the fish and shifted the endpoint. In toxicology, timing is often as important as magnitude. A system that records both gives reviewers a clearer picture of cause and effect.
The Hidden Costs of Assuming Stable Exposure
Many labs still rely on manual grab sampling because it is familiar and inexpensive at the bench level. The hidden cost shows up later. If exposure stability is assumed rather than measured, studies may need to be repeated. Unexpected mortality may be blamed on the compound when the real driver was a pump failure or a clogged line. Nominal concentrations get reported as if they were actual concentrations. Statistical power drops when variability from water chemistry is treated as biological noise. Real-time monitoring does not eliminate every failure, but it makes failure visible early, when a line can be flushed or a chamber excluded before the whole study is compromised.
Matching Sensor Drift and Biological Variability
Sensors are not perfect. Dissolved oxygen probes foul. pH electrodes age. Ammonia sensors drift with temperature and ionic strength. That does not make real-time monitoring pointless. It makes calibration and maintenance part of the experimental design. The key is to match sensor performance with the biological question. If the endpoint is a subtle behavioral change over several days, a sensor that drifts by a meaningful amount over that same window can create false trends. A useful approach is to combine continuous monitoring with periodic reference checks. The reference checks anchor the signal to a trusted method. Guidance such as OECD 203 and OECD 236 emphasizes controlled exposure conditions, and auditors tend to appreciate a clear record of how those conditions were maintained.
A Field Lesson from a Pilot Toxicological Study
During a pilot toxicological study at a wastewater reuse facility in southern China, the team noticed an odd pattern. Fish in one exposure lane showed reduced movement in the afternoon, while the adjacent lane looked normal. Manual sampling in the morning had shown nothing unusual. Continuous monitoring told a different story. Dissolved oxygen in the affected lane dipped after a valve cycled, and the dip lined up with the behavioral change. The valve was not part of the original test plan, but it was part of the real hydraulic system. Once the flow path was adjusted, the behavior returned to baseline. The case is a good reminder that zebrafish toxicological exposure systems sit inside a physical world of pumps, tubing, valves, and biofilm. Real-time data does not just protect the fish. It protects the interpretation.
| Monitoring approach | Data density | Spike detection | Exposure confidence | Labor pattern |
|---|---|---|---|---|
| Manual grab sampling | 1 to 3 samples/day | Low | Moderate | Scheduled, labor heavy |
| Periodic logging | Minutes to 15 min | Medium to high | Strong if maintained | Setup heavy, low daily touch |
| Continuous real-time | Seconds to minutes | High | Strong with checks | Front loaded, responsive |
Practical Design Choices for Better Real-Time Data
A real-time system does not need every sensor on the market. It needs a clear measurement plan. Start with variables that can change the toxicological exposure or the animal's physiology. Temperature, dissolved oxygen, and pH are usually non-negotiable. Flow rate is close behind, because flow controls renewal and dose delivery. Sensor placement deserves real thought. A probe in the sump may not represent the chamber where fish actually swim. Tubing length, dead volume, and mixing time can create a lag between the real event and the recorded event. Finally, data should be stored with timestamps and calibration notes. A real-time graph is only as good as the record behind it.
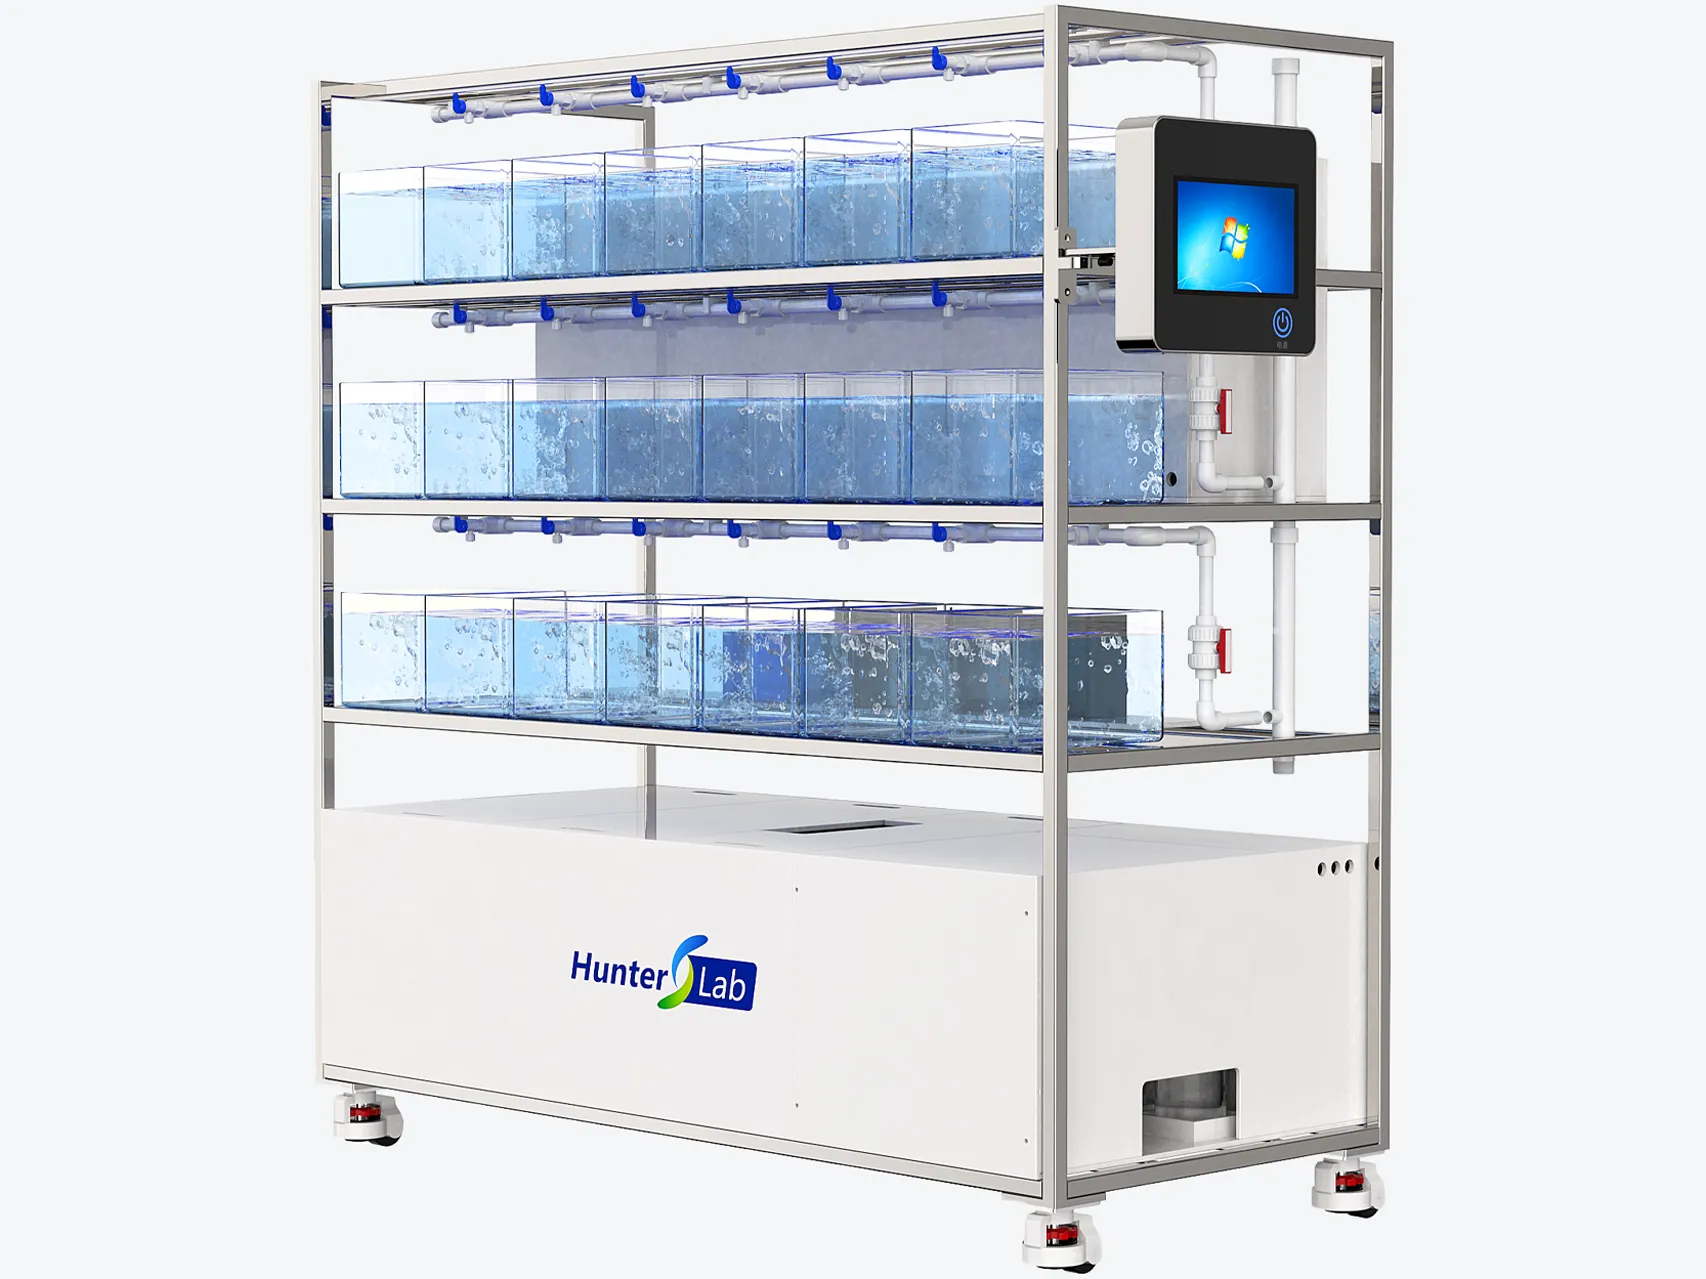
Hunter Lab builds and supports equipment for zebrafish research, with an eye on practical details that decide whether a study survives contact with a real lab. That includes manufacturing discipline, incoming material checks, and supply chain coordination that keeps spare sensors and consumables available without turning a bench into a warehouse. The focus is not on adding screens for their own sake. It is on giving researchers reliable signals, clear documentation, and hardware that can handle continuous use. Real-time monitoring is not a magic fix for every toxicology question. It is a tool that, when matched to the right endpoint and maintained with honest calibration, makes exposure studies more transparent and more reproducible.








