
 EN
Why visual inspection alone keeps missing the early signs
Vascular abnormalities rarely announce themselves. In the early stages of atherosclerosis, peripheral artery disease, or even congenital conditions like Marfan syndrome, the structural changes happen at a scale that human eyes simply cannot resolve during a routine exam. A clinician looking at a fundus photograph can spot gross tortuosity or obvious narrowing, but subtle vessel wall thickening, early plaque formation, or microaneurysms often slip through. This isn't a failure of expertise. It's a limitation of resolution and consistency. Automated analysis changes that equation entirely.
A cardiovascular analysis system does not replace clinical judgment. It sharpens it. By extracting quantitative features from imaging and physiological signals, these platforms convert what was once a subjective impression into a measurable, repeatable metric. And that shift matters, because the data now emerging from large-scale studies is getting hard to ignore.
The data engine behind the shift
The numbers are striking. A deep learning system trained on over 5,000 scleral photographs achieved an overall accuracy of 0.891 and an AUC of 0.942 for coronary heart disease risk assessment, matching specialist physician agreement. The model predominantly relied on vascular abnormalities as its interpretable features, not pigmentation or other confounders. In other words, the algorithm learned to look at the vessels, the same way a trained clinician would, but with the consistency that only a machine can provide.
For carotid ultrasound, an improved Mask R-CNN framework reached 93.5% accuracy in plaque detection and measured intima-media thickness with an error margin of just 0.112 mm. That level of precision on a structural parameter is not achievable through manual caliper placement alone.
| Modality | Task | Reported Performance |
|---|---|---|
| Scleral photography | CHD risk assessment | Accuracy 0.891, AUC 0.942 |
| Carotid ultrasound | Plaque detection | Accuracy 93.5% |
| Carotid ultrasound | IMT measurement error | 0.112 mm |
| Retinal fundus imaging | Cerebrovascular screening | Validated on 2,338 expert-diagnosed cases |
The AHA has taken notice. In a 2026 science advisory, the organization acknowledged that machine learning and deep learning models demonstrate strong performance in automating peripheral artery disease detection and enhancing diagnostic accuracy through advanced imaging analysis. That is not a fringe endorsement. It is a signal that automated vascular assessment has crossed from research curiosity into clinical relevance.
What the system actually measures, and why it matters
The confusion around cardiovascular analysis systems often comes from lumping very different technologies under one umbrella. The reality is that the category spans multiple modalities, and each one targets a different window into the vascular system.
-
Retinal microvasculature. Color fundus photography captures vessels that share embryological origins with cerebral and coronary circulation. Changes in arteriovenous ratio, vessel tortuosity, and microaneurysm formation correlate with systemic disease. Deep learning models now routinely segment these vessels and classify artery versus vein with accuracy exceeding 98% in validated studies.
-
Scleral and conjunctival vasculature. Less conventional but increasingly validated. Scleral vessel patterns provide a non-invasive read on coronary risk, and the interpretable features align with what the model is actually attending to.
-
Intravascular imaging. For coronary artery anomalies, automated processing of IVUS data now enables precise quantification of geometric changes at rest and under stress, something that manual analysis struggles to do consistently.
-
Physiological signal fusion. Systems that combine ECG and phonocardiogram data catch electrical and mechanical abnormalities that neither signal reveals alone. The engineering challenge here is real. Deploying CNN models on wearable edge devices hits memory bottlenecks, which is why custom ASIC designs with shift-register buffering and pipelined datapaths have emerged to achieve deterministic latency without draining battery life.
Here is a pattern worth paying attention to. The most successful deployments are not trying to replace angiography or CTA. They are positioning automated analysis as a triage layer, a first pass that flags which patients need the expensive, invasive follow-up.
Zebrafish as a translational validation platform
There is a quiet revolution happening in preclinical vascular research, and it is swimming in tanks. Zebrafish larvae are transparent, develop rapidly, and share roughly 70% of their genes with humans in orthologous form. For vascular abnormality studies, that transparency means every vessel can be imaged in vivo without dissection or contrast agents.
The model is not just convenient. It is mechanistically informative. Studies using low-density lipoprotein receptor knockout zebrafish have revealed how flow-mediated endothelial remodeling and inflammation converge during embryogenesis to drive vascular susceptibility. In a Marfan syndrome model, fibrillin-3 deficient fish exhibited aortic dilation and valvular abnormalities mirroring human disease, with transcriptomic analysis pointing to altered extracellular matrix homeostasis and immune activation.
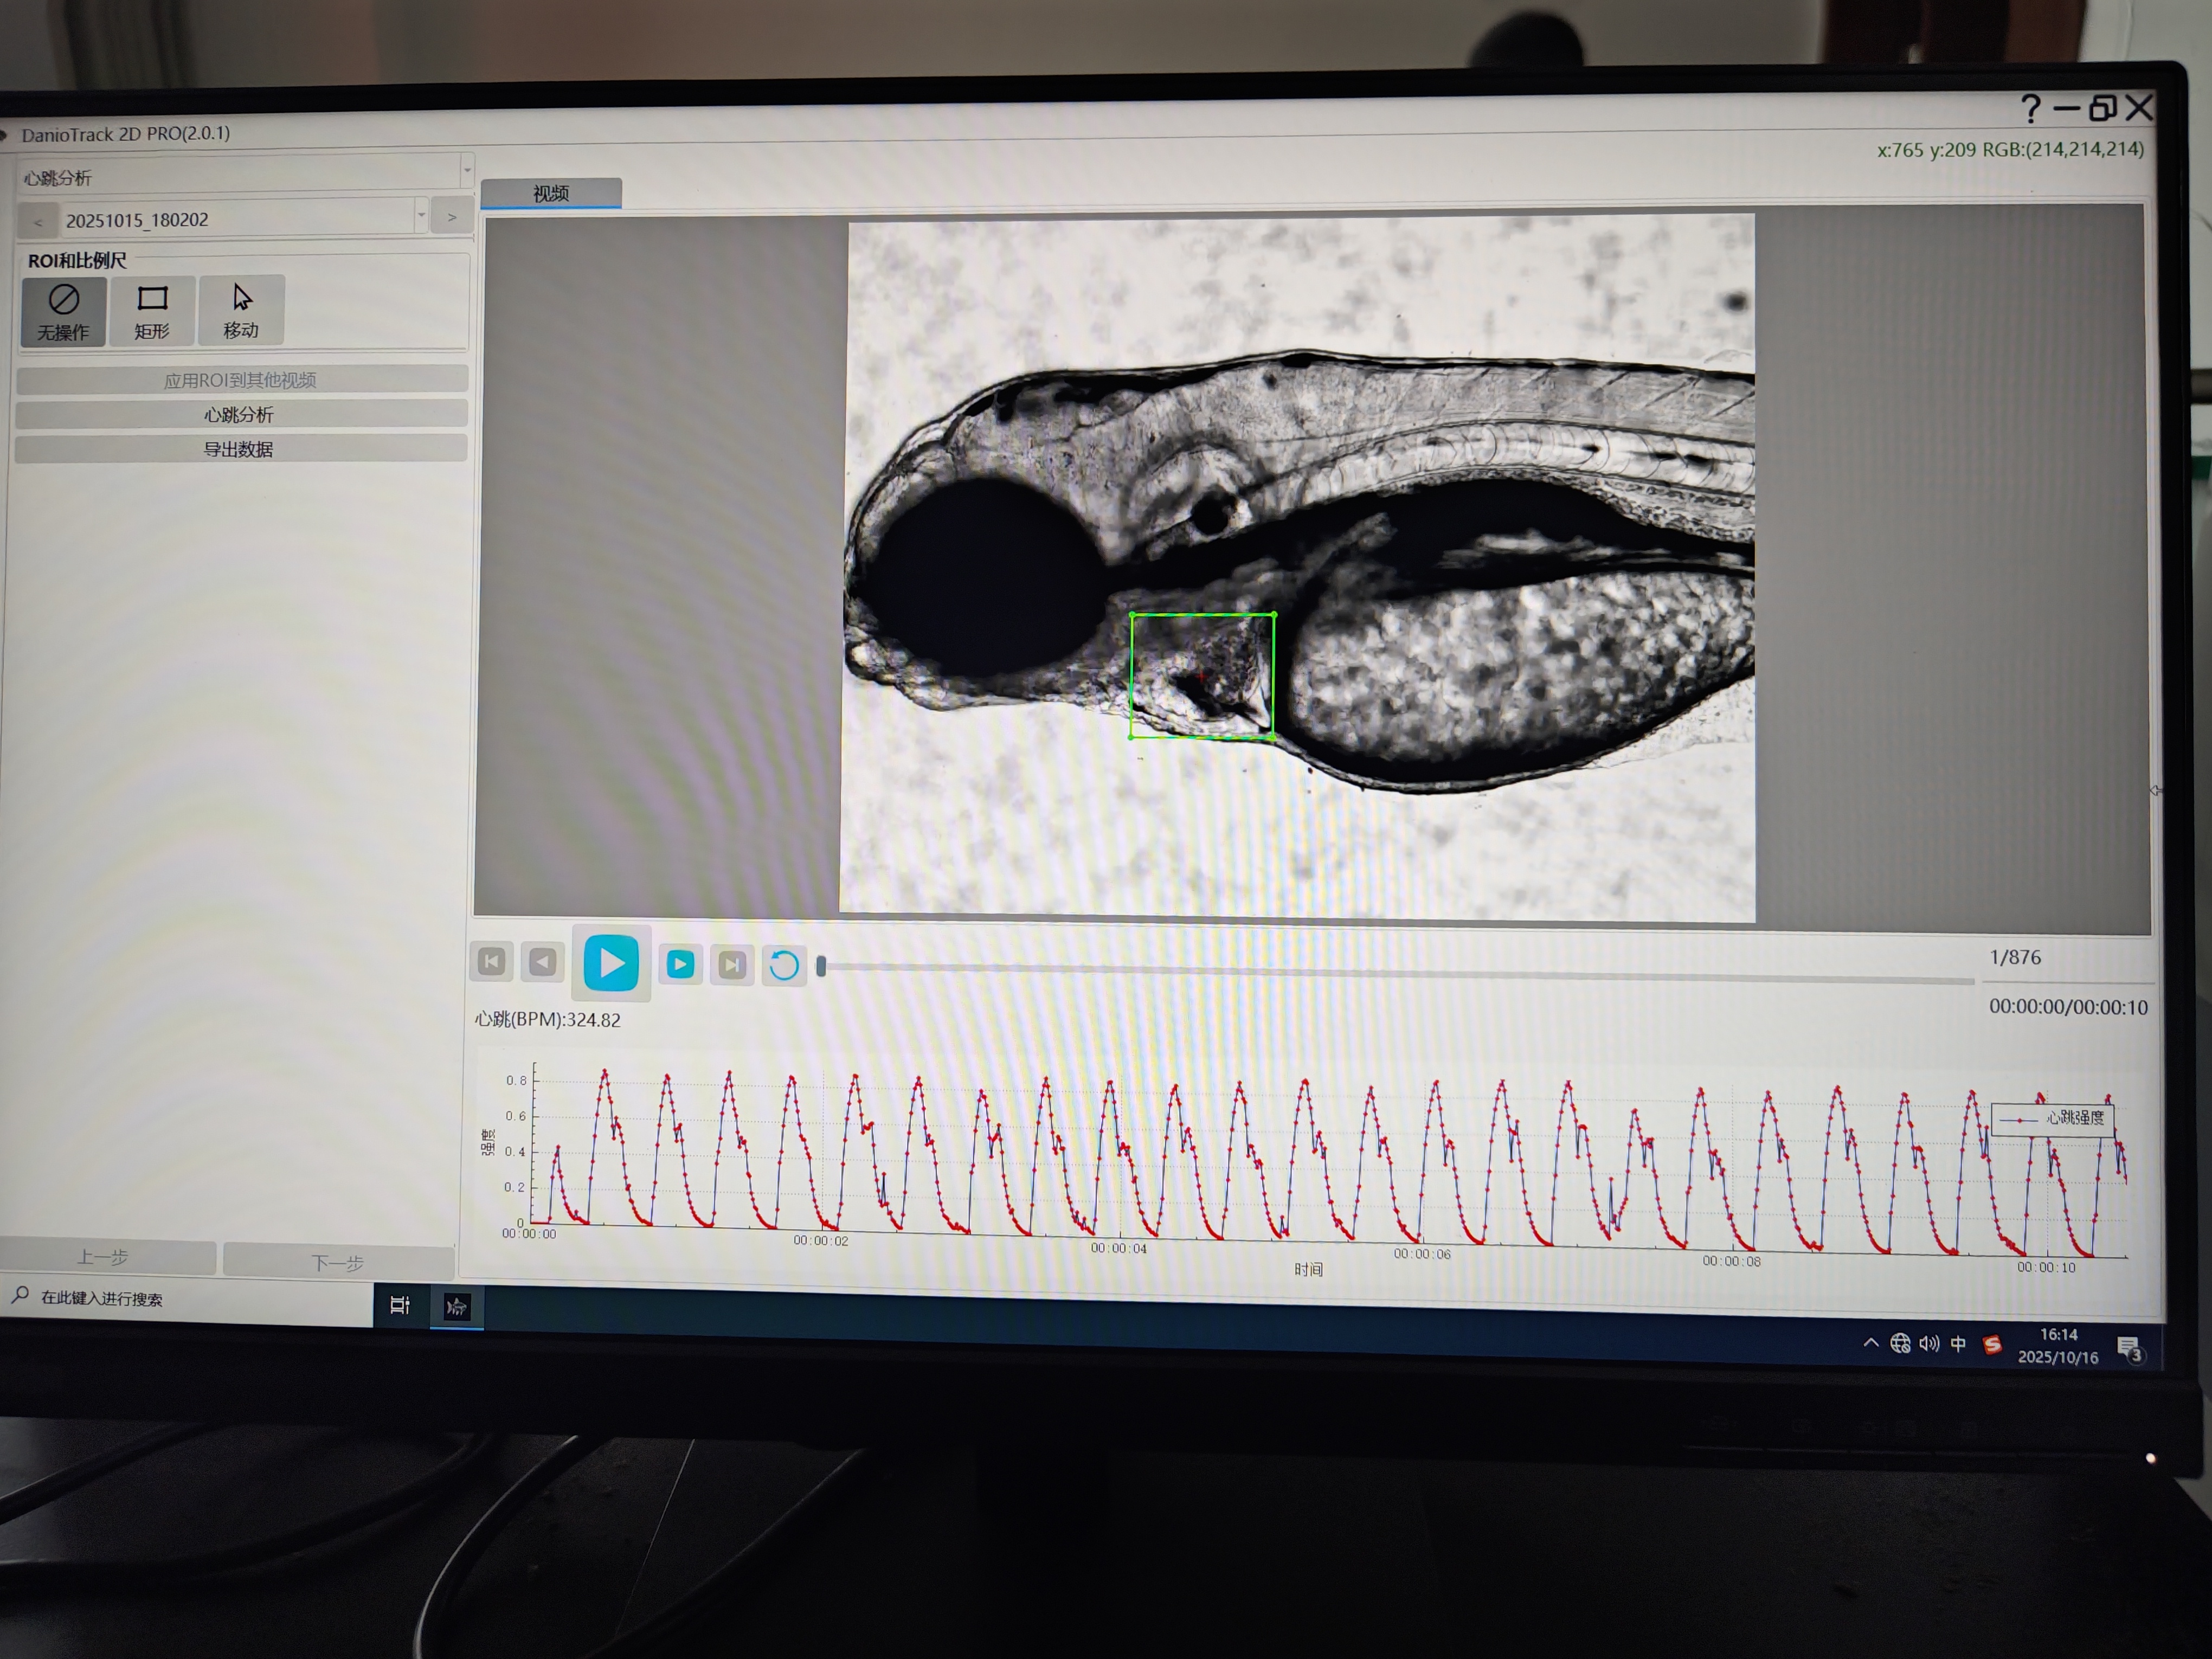
What makes this relevant to detection technology is the imaging requirement. These models demand systems that can track blood flow velocity and vessel diameter in real time, at micron resolution, without anesthesia confounding the physiology. Non-invasive microvision systems using color thresholding and discrete Fourier transform filtering have been developed specifically to identify dorsal cardinal vein position and derive blood flow velocity from pixel value change rates. The heart rate information derived from blood flow velocity matched the actual heart beating frequency, which is the kind of cross-validation that gives engineers confidence in the signal chain.
For a team building or evaluating a cardiovascular analysis system, zebrafish work offers something rare: a ground-truth environment where every parameter can be measured independently and the system's output can be checked against direct observation.
A case from the field: when the algorithm caught what the eye missed
A few years back, a research group working on a drug toxicity screening program noticed something odd in their zebrafish data. The automated cardiovascular analysis system was flagging a subset of larvae as abnormal based on blood flow velocity patterns, but the manual reviewers had cleared them. The vessels looked fine under the microscope.
The group ran the samples through fluorescence imaging. The vessels were structurally normal. But the flow was off. Not dramatically, not in a way that would trigger alarm during visual inspection, but consistently and reproducibly slower in the treated group compared to controls. Further investigation pointed to a subtle effect on endothelial cell function that altered vessel wall compliance without changing gross morphology. The kind of thing that would never show up on a standard histology slide.
That is the value proposition of automated analysis in one anecdote. It is not about finding what a trained eye can find, faster. It is about finding what the trained eye was never able to see in the first place.
The limitations nobody talks about at conferences
Honesty matters here. Cardiovascular analysis systems are not magic, and the field has real problems.
Generalizability is the big one. A model trained on one population's fundus images may not perform equally well on another demographic. A review of deep learning fundus analysis explicitly notes that current models still face challenges in robustness to low-quality images and clinical interpretability. If the input image is blurry, poorly illuminated, or captured with a different camera sensor, performance degrades. This is not a software bug. It is a data distribution problem, and it requires deliberate engineering to solve.
Regulatory pathways remain fragmented. The FDA has cleared some autonomous AI algorithms for diabetic retinopathy screening, but vascular abnormality detection spans a wider range of conditions and modalities, each with its own validation requirements. And there is the practical question of workflow integration. A tool that produces a risk score is only useful if it fits into an existing clinical pathway without adding friction.
The most responsible framing is this. Automated vascular analysis is a screening and triage tool. It augments the diagnostic chain. It does not replace the angiogram.
The commercial ecosystem behind the technology
Getting these systems from prototype to reliable product is not just an algorithm problem. It is a manufacturing and supply chain problem. Optical components need consistent alignment. Camera sensors need matched sensitivity curves. Fluid handling modules for zebrafish platforms need to maintain physiological conditions across thousands of experimental wells without introducing variability.
This is where companies with deep manufacturing roots in lab instrumentation have an edge. Hunter Lab, the abbreviated name of the organization behind zebrafish-lab.com, has built its reputation on the production side of this ecosystem. The company's work spans the hardware layer, from high-speed imaging modules to microfluidic components, with a focus on batch-to-batch consistency that research-grade systems demand. For teams evaluating cardiovascular analysis platforms, the supply chain question is not glamorous, but it is often the difference between a system that works in one lab and a system that works in fifty.
The next phase of this field will be defined less by algorithmic breakthroughs and more by engineering discipline. The models are already good enough to be useful. Making them trustworthy, reproducible, and manufacturable at scale is the harder problem.








