
 EN
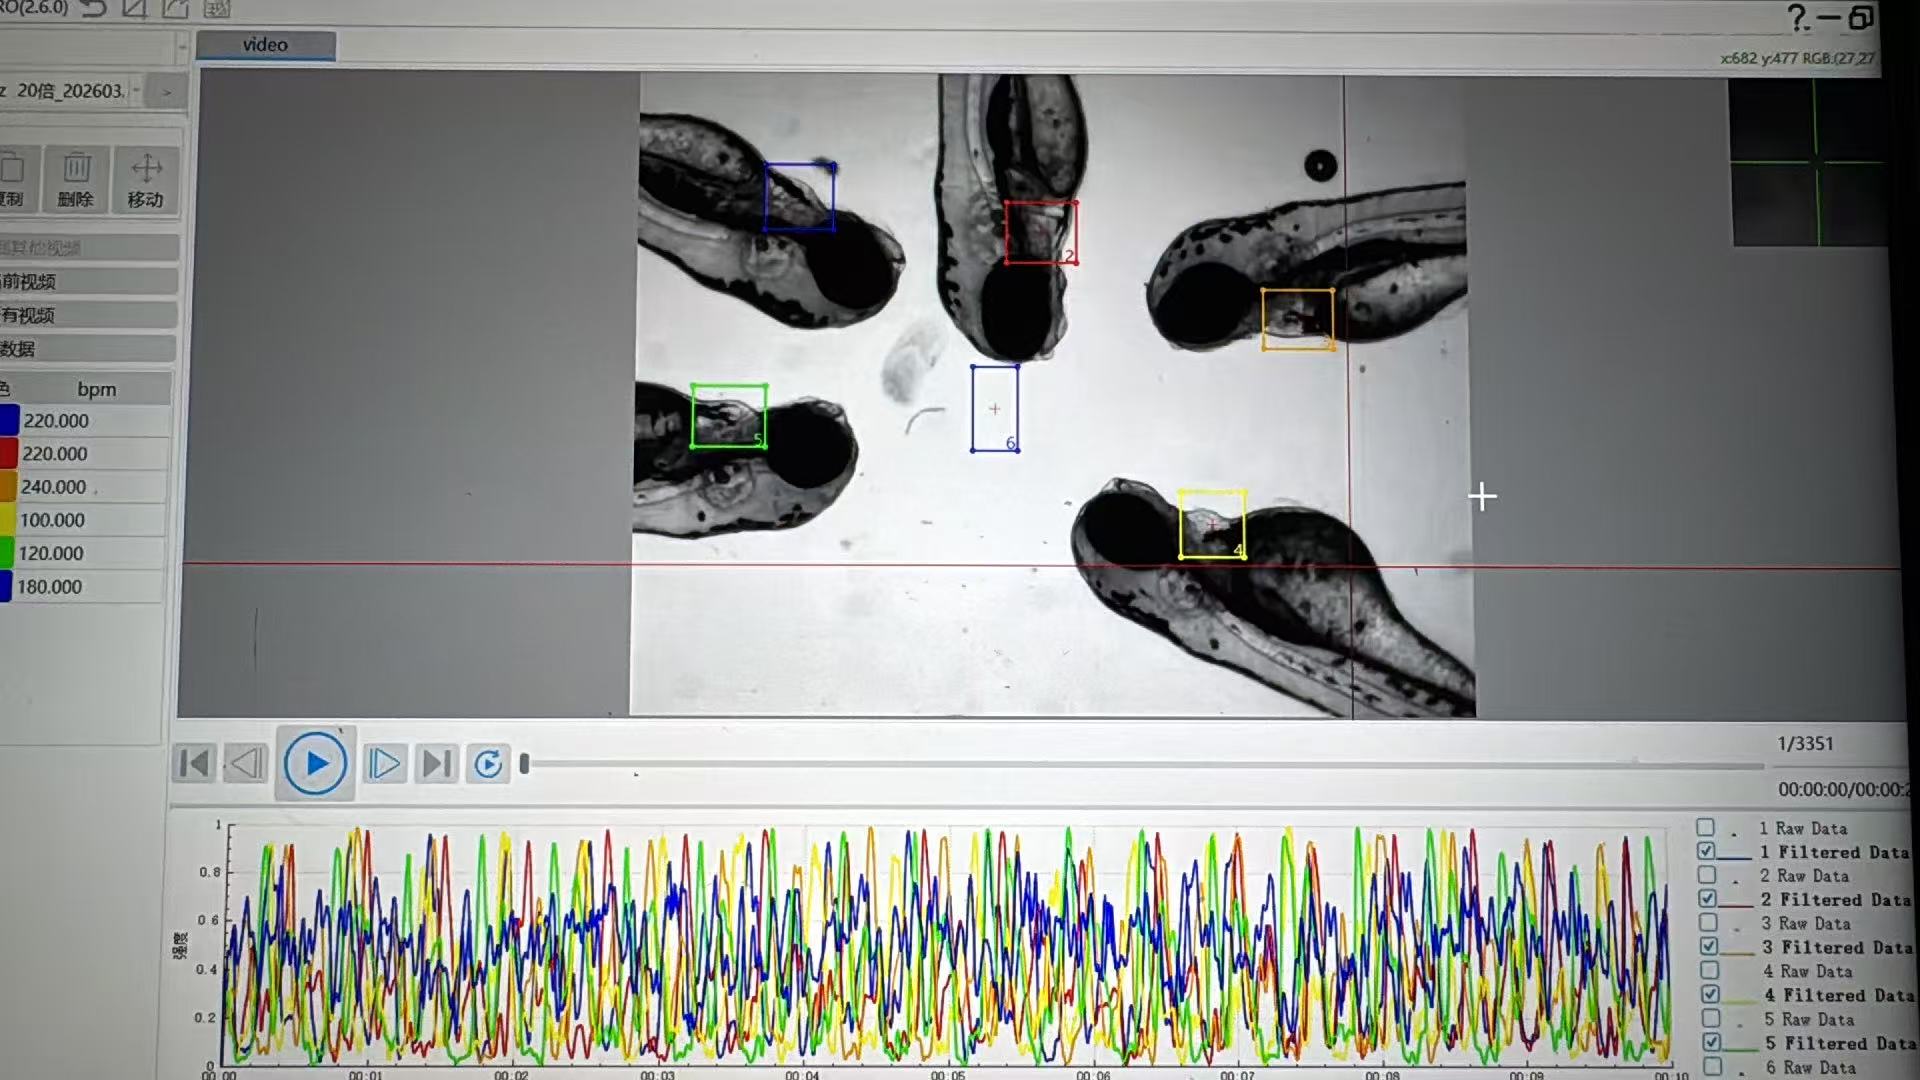
A Zebrafish Cardiovascular Analysis System does not usually need two separate experiments to examine cardiac timing and circulation. It starts with a time-resolved image sequence of the same larva, then applies different analyses to that shared sequence. One analysis follows the repeating motion of the heart to calculate heart rate; the other follows moving blood cells or changing vessel intensity to estimate blood flow. The value of simultaneous measurement is not merely speed. Both readouts describe the animal under the same developmental stage, handling conditions, temperature, and exposure window.
As researchers working with zebrafish cardiovascular assays know, a useful answer depends on the protocol as much as on the camera. A Zebrafish Cardiovascular Analysis System is therefore better understood as an acquisition-and-analysis workflow: stabilize the specimen, capture a sufficiently resolved movie, define cardiac and vascular regions of interest, and calculate paired metrics with settings recorded for every group.
One image sequence, two physiological signals
The starting point for a Zebrafish Cardiovascular Analysis System is usually bright-field or fluorescence video microscopy. The larval heart contracts in a visible cycle, while blood cells move through nearby vessels. Because both events occur in the same field or in synchronized fields, one movie can retain the timing relationship between contraction and perfusion.
This is why a The analysis workflow should be evaluated by more than a single output number. Video microscopy has been used to obtain basic cardiac and vascular readouts, including heart rate and blood flow. In embryonic zebrafish, a cardiac cycle can be fast enough that temporal resolution matters; a review describes cardiac motion in a roughly 2–4 Hz context. The practical point is conditional: the acquisition interval has to resolve the individual phases relevant to the chosen measurement, rather than blur them into an average.
How the system derives heart rate
For heart-rate analysis, the The workflow selects a region that contains the ventricle, atrium, or both, depending on the assay. Each frame is converted into a signal that changes as the chamber wall moves. That signal may be based on pixel intensity, edge displacement, chamber area, or a motion-tracking measure. Peaks or repeating transitions identify individual beats.
The analysis software then measures the interval between equivalent points in successive cycles. Converting the mean interval to beats per minute yields heart rate. A The platform can also retain beat-to-beat intervals, which is useful when rhythm regularity matters. The important distinction is that a rate is a timing metric: it says how often the heart cycles, not how much fluid reaches a particular vessel.
For defensible heart-rate measurement, keep the analysis window long enough to contain several cycles and inspect whether motion from the whole larva is being mistaken for cardiac motion. If the trace contains abrupt steps caused by drifting, focus changes, or a larva leaving the region of interest, a numerical result alone should not be accepted without review.
How the same recording yields blood flow
For flow analysis, the The same workflow uses a vessel region rather than the chamber region. It can track visible erythrocyte features from frame to frame, estimate a displacement field, or quantify changes in intensity as cells pass through a defined line. Distance moved per frame, together with the calibrated pixel size and frame timing, supports a velocity estimate. Repeated observations across the video characterize pulsatile blood flow rather than a single still-image impression.
A The analysis may report velocity, transit behavior, relative flow index, or a related vessel-specific metric. These outputs are not interchangeable. Volumetric flow, for example, requires assumptions or measurements about vessel cross-section in addition to velocity. A clear analysis plan names the vessel, metric, calibration method, and summary statistic before data collection begins.
Simultaneous analysis is helpful here because a lower blood-flow value can be interpreted alongside the concurrent cardiac rhythm. If flow changes while heart rate is stable, the team may examine vascular resistance, red-cell movement, or imaging geometry. If both values shift, the next question may concern a broader change in cardiac function or the experimental environment. These are hypotheses for follow-up, not diagnoses supplied by the software.
What makes paired measurement credible?
A A paired-measurement workflow needs a consistent acquisition recipe. Stage larvae by the same convention, keep temperature stable during imaging, and use the same orientation whenever the protocol compares groups. Changes in illumination, magnification, frame timing, or vessel choice can alter the measured signal even when biology has not changed.
- Match the regions of interest to the question. Cardiac timing belongs in a heart region; flow should be read from a pre-defined vessel segment.
- Record acquisition metadata. Frame rate, pixel calibration, objective, exposure, and analysis-window length make later review possible.
- Handle motion consistently. Mounting, anesthesia approach, and exclusion criteria should be decided before comparing groups. Anesthesia dose is not a fixed target; its effect can depend on developmental stage and protocol.
- Review the underlying trace or overlay. The image often catches a tracking error that a summary table hides.
- Use biological replicates and transparent exclusions. A Zebrafish Cardiovascular Analysis System supports measurement; it does not replace experimental design.
Why synchronization matters
In a conventional workflow, one operator may score heart rate in one session and assess blood flow later. A The synchronized workflow keeps the two measurements anchored to the same animal and video segment. That reduces ambiguity introduced by developmental progression or a different handling event between sessions. It also lets a laboratory ask whether flow peaks align with cardiac cycles and whether a change persists across repeated recordings.
Still, simultaneous does not mean that every variable is controlled automatically. The The method must be validated for the species stage, imaging geometry, and endpoint the study uses. Labs should compare automated annotations with manually reviewed examples, particularly when a treatment changes morphology, contrast, or movement patterns that the algorithm relies on.
A practical workflow for the measurement
- Use the workflow to set up a stable, repeatable imaging field for each larva.
- Capture a time-resolved sequence that resolves both heart motion and the selected vessel.
- Define a cardiac region and a vessel region before batch analysis.
- Run heart-rate and blood-flow analysis on the same timestamped recording.
- Inspect representative traces, tracking overlays, and exclusions before summarizing groups.
- Report the acquisition settings and the precise metrics, not only the final comparison.
When used this way, the workflow turns a single dynamic recording into complementary cardiac and vascular evidence. The strength of the simultaneous measurement is its shared context: rate and flow can be assessed together, while their different biological meanings remain clear.








