
 EN
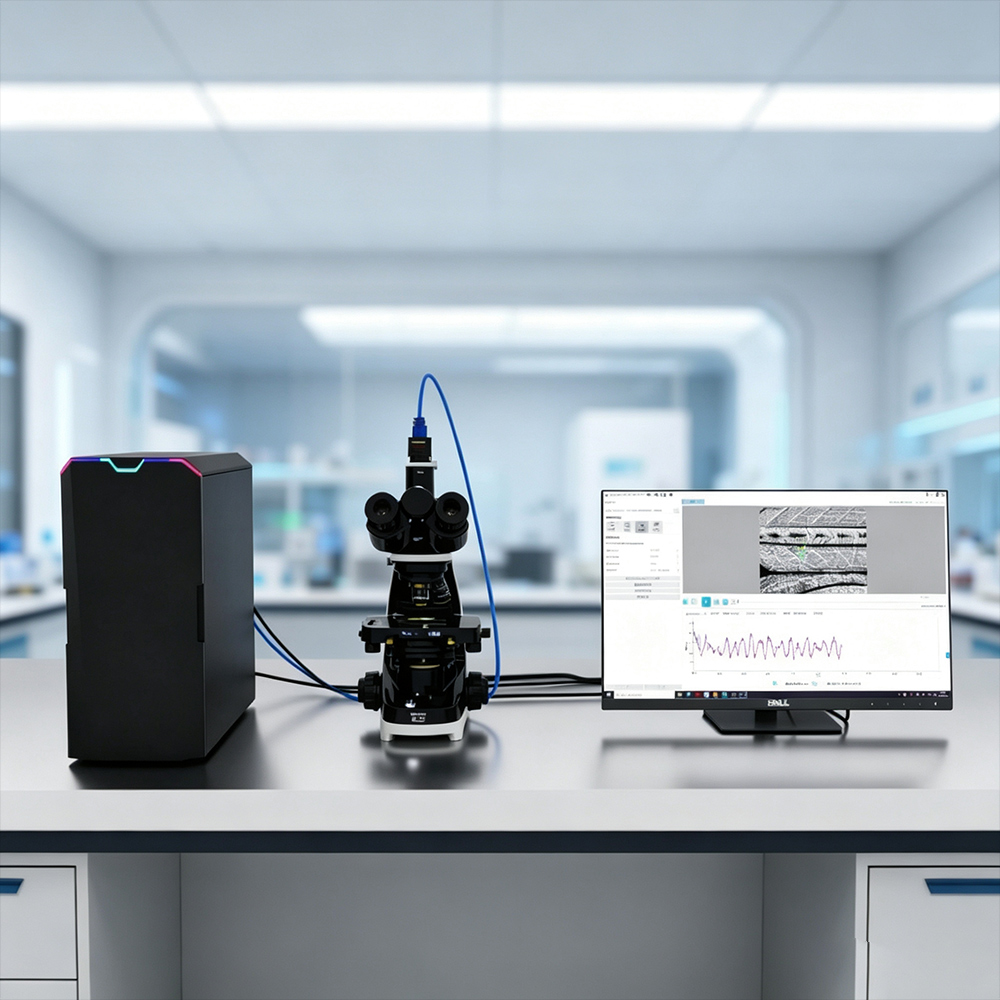
How does a zebrafish behavioral analysis system quantify anxiety-like behaviors?
A Zebrafish Behavioral Analysis System does not measure anxiety as a clinical diagnosis. It converts repeatable video observations into predefined behavioral endpoints that researchers interpret as anxiety-like responses within a controlled assay. That distinction matters. A fish that travels less may be less exploratory, sedated, developmentally affected, or simply adapting to a new arena. A useful workflow therefore combines spatial preference, locomotion, timing, and experimental controls rather than treating one number as a verdict.
In practice, the Zebrafish Behavioral Analysis System records a standardized arena, identifies each fish across video frames, reconstructs its path, and summarizes that path by zone and time. The output becomes meaningful only after the laboratory has defined the assay, baseline, exclusion rules, and comparison group. Conditional qualification is important here: an endpoint can be informative under stable lighting, temperature, age, strain, and handling conditions, but it should not be generalized beyond those conditions without validation.
Start with an assay that makes anxiety-like behavior observable
The system first needs an arena with a behavioral contrast. In an open-field-style assay, the contrast is usually a center zone versus a wall-adjacent zone. In a novel-tank assay, it may be upper versus lower regions. A light/dark design instead creates a lighting contrast. These layouts do not assign an emotional state by themselves; they create repeatable choices that a Zebrafish Behavioral Analysis System can quantify.
Before recording, the team defines the observation window, acclimation period, zone boundaries, camera view, number of animals, and treatment-versus-control comparison. It also documents water conditions, time of day, developmental stage, and any stimulus sequence. These choices help distinguish biological change from a change in the testing environment. For example, a different reflection pattern or a noisy room can alter exploration even when treatment is unchanged.
How video becomes a behavioral data table
A typical Zebrafish Behavioral Analysis System follows three linked stages: acquisition, tracking, and endpoint extraction. During acquisition, a camera captures the arena at a frame rate suitable for the movement being studied. During tracking, software estimates the fish position in each frame and joins positions into a time-stamped trajectory. During endpoint extraction, the trajectory is converted into measurements that can be compared across fish and groups.
Quality control belongs in every stage. The image should have enough contrast to separate fish from background; the arena should be calibrated so pixels map consistently to distance; and the analyst should inspect a sample of tracks for missed identities, reflections, or merged animals. Automated tracking reduces manual scoring burden, but it does not remove the need to verify the tracking output. If the path is wrong, every downstream quantification is wrong in a very consistent-looking way.
Measure thigmotaxis as a spatial preference, not a standalone label
Thigmotaxis describes wall-oriented movement. In a zone-based arena, a Zebrafish Behavioral Analysis System can report time in the peripheral zone, entries into the center, latency to first center entry, distance traveled near the wall, and the proportion of the path located at the edge. Greater wall-zone occupancy together with reduced center exploration is often interpreted as an anxiety-like pattern when the protocol and control comparison support that interpretation.
What matters is the pattern, not merely the percentage. A fish can remain near the wall because it is highly active but circling; another can remain near the wall because it is nearly immobile. Both might increase peripheral occupancy, yet their locomotion profiles are different. A Zebrafish Behavioral Analysis System should preserve both spatial and movement endpoints so the analyst can see that difference.
Use locomotion to separate exploration from general activity change
Common movement outputs include total distance traveled, mean speed, peak speed, time moving, time inactive, turning behavior, movement-bout count, and bout duration. A Zebrafish Behavioral Analysis System may also calculate these values separately for each zone. That makes it possible to ask a more precise question: did the fish avoid the center while continuing to explore the perimeter, or did activity fall across the entire arena?
Suppose a treated group shows less center time, fewer center entries, and normal total distance. That combination can support an anxiety-like interpretation more clearly than reduced center time alone. Conversely, if center time, total distance, and movement-bout frequency all decline sharply, a sedative, motor, or health-related effect may be an alternative explanation. This is why anxiety-like quantification should include a locomotor context rather than a single zone metric.
Turn endpoints into a defensible comparison
Once the Zebrafish Behavioral Analysis System exports individual-fish endpoints, analysis should retain the fish as the unit of observation unless the design justifies another unit. Compare treated and control groups using a prespecified method, visualize individual values as well as group summaries, and report exclusions before interpreting results. For repeated observations, keep the time bins rather than collapsing the entire session immediately; adaptation over time can be as informative as the session total.
A practical endpoint panel might include peripheral-zone time, center-entry count, latency to center, total distance, mean speed, inactive time, and movement-bout features. The panel provides converging evidence while making disagreement visible. For example, increased thigmotaxis without any locomotor difference suggests one type of pattern; reduced activity everywhere suggests another. The right conclusion depends heavily on the assay conditions and the broader phenotype.
Control the factors that can imitate an anxiety-like signal
Interpretation is strongest when the Zebrafish Behavioral Analysis System is paired with consistent husbandry and recording conditions. Standardize tank geometry, water temperature, illumination, camera position, trial duration, feeding schedule, handling, and order of testing. Randomize treatment placement when possible and blind the analysis labels. Include a vehicle or untreated reference group processed at the same time.
It is also wise to define exclusions in advance: tracking loss, abnormal posture, technical failure, or a condition that makes the task impossible to perform. Excluding data only after seeing group outcomes can create bias. A short pilot helps refine zone geometry and thresholds before the confirmatory run. Even a carefully configured Zebrafish Behavioral Analysis System cannot compensate for an assay whose conditions vary between groups.
What a clear report should say
A credible report names the assay, the observation window, the tracked endpoints, zone definitions, calibration approach, QC process, and comparison method. It should say “anxiety-like behavior” rather than claiming that fish experience a human mental state. It should also state whether movement effects could confound the interpretation. That careful language is not a limitation; it makes the Zebrafish Behavioral Analysis System useful for reproducible screening and mechanistic follow-up.
In short, the system quantifies behavior by converting trajectories into spatial and movement measures. When thigmotaxis, exploration, and locomotion are evaluated together under controlled conditions, researchers obtain a transparent basis for comparing anxiety-like behavioral responses across groups.








