
 EN
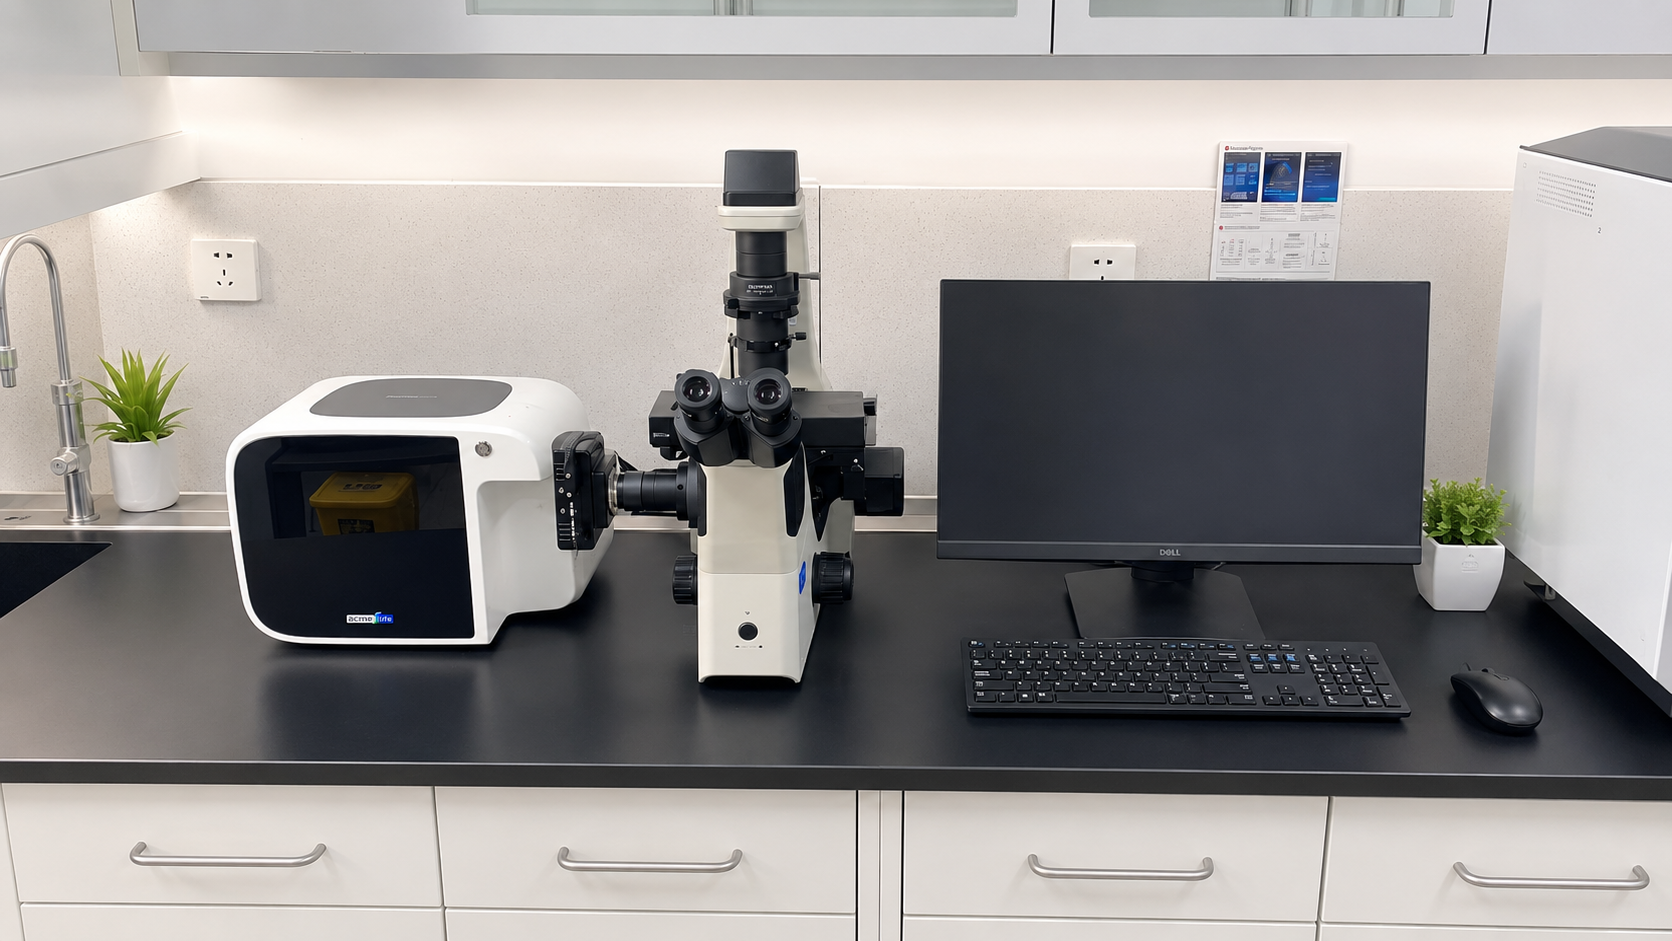
A Zebrafish Cardiovascular Analysis System detects vascular abnormalities by converting repeatable images of living larvae into measurements that can be reviewed: vessel course, lumen width, branching pattern, blood-cell movement, and cardiac motion. The important word is repeatable. A striking image may suggest a phenotype, but a defensible detection workflow compares each larva with an age-matched control group collected under the same conditions.
For researchers working with transparent embryos and larvae, imaging offers a practical window into the developing circulation. Optical methods have been used for non-invasive cardiovascular observation at early developmental stages. A well-planned Zebrafish Cardiovascular Analysis System makes that observation useful by preserving the image sequence, recording acquisition conditions, and applying the same measurement rules to every sample.
Start with an image sequence that can answer a vascular question
Detection begins before software analysis. Define what would count as an abnormality in the specific assay: interrupted perfusion, an unusually narrow or wide segment, altered branching, delayed flow, edema that obscures landmarks, or a mismatch between heart motion and downstream circulation. That definition determines the field of view, magnification, frame rate, illumination, and duration of recording.
For vascular abnormalities, a short still image is often insufficient. Time-resolved imaging lets the operator separate a vessel that is anatomically present from one that is poorly perfused. Published high-speed imaging approaches have demonstrated quantitative measurement of blood flow and vessel diameter in zebrafish. A Zebrafish Cardiovascular Analysis System can use the same logic without treating any single metric as decisive on its own.
- Morphology channel: segment vessels, trace centerlines, and compare diameter, continuity, tortuosity, and branch junctions.
- Flow channel: review moving blood cells or contrast features across frames to identify direction, intermittent perfusion, stasis, or asymmetric flow.
- Cardiac context: capture heart motion and rate alongside vascular images, because circulation depends on both pump function and vascular structure.
Build a baseline before calling a defect
The most common mistake is treating a visual difference as a vascular defect before establishing normal variation. Developmental stage, strain, clutch, temperature, water chemistry, orientation, and handling can all influence the appearance of the cardiovascular system. Heart rate offers a useful warning: reports place embryonic zebrafish values in a broad context around 120–180 beats per minute, but that range depends heavily on age and conditions. It is better to establish a same-session control distribution than to import a universal threshold.
We often find that the imaging equipment is not the limiting factor. A sequence that looks like reduced flow may instead reflect inconsistent immobilization or delayed acquisition after anesthesia. Standardize the interval between preparation and recording, log temperature, and keep the anatomical orientation consistent. Those small controls make vascular abnormalities easier to distinguish from handling artifacts.
How the analysis pipeline turns images into flags
A Zebrafish Cardiovascular Analysis System usually follows a staged pipeline rather than making a black-box diagnosis. First, it checks image quality: focus, exposure, motion, orientation, and whether the selected region contains the intended vessel. Next, it identifies comparable landmarks in controls and test larvae. Then it extracts features and ranks samples for review.
- Acquire and register frames. Stabilize the sequence so motion of the larva does not look like vessel displacement.
- Segment vessels and regions of interest. Delineate the dorsal aorta, posterior cardinal vein, intersegmental vessels, or assay-specific landmarks using the same rules across groups.
- Measure shape and continuity. Compare diameter profiles, branch counts, vessel length, gaps, and relative symmetry with controls.
- Estimate flow behavior. Use frame-to-frame movement to assess whether flow is continuous, reduced, reversed, or absent in a defined region.
- Review outliers with source frames. Each flag should link back to the original image sequence rather than merely a summary value.
This order matters because automated analysis earns its place when a study has enough samples to make manual scoring inconsistent, but it still requires a validation run on the laboratory's own imaging setup. Manual review remains valuable for rare, mixed, or borderline phenotypes.
Interpret vascular abnormalities in context
A narrow vessel does not automatically mean the same biological event as a gap in perfusion. A Zebrafish Cardiovascular Analysis System should therefore group measurements into interpretable patterns. For example, reduced lumen width with preserved rhythmic flow may suggest a morphology-focused follow-up. Preserved vessel shape with intermittent or absent downstream flow calls for closer review of cardiac output, timing, and preparation conditions. Abnormal branching with otherwise normal flow may require a developmental-angiogenesis lens.
Imaging is especially useful because it can connect these observations. The system can overlay a vessel mask on the original frame, plot a diameter profile along a defined segment, and retain a clip showing red-cell movement. That evidence trail allows another researcher to check whether the automated detection reflects a real phenotype or a segmentation error.
Use controls and confirmation to avoid false positives
Detection becomes reliable when the workflow includes matched negative controls, repeated acquisitions when feasible, blinded review for borderline samples, and predefined exclusion rules. Confirm suspected vascular abnormalities in a second run or with an orthogonal observation when the study objective requires it. In particular, distinguish technical exclusions such as poor focus or body rotation from biological findings; combining them in one category makes the analysis hard to interpret.
For high-throughput imaging, set image-quality criteria before calculating phenotype rates. Exclude frames that fail focus or orientation checks, document the reason, and report how many larvae were analyzed after quality control. That practice makes the analysis more transparent and keeps a detection score from being mistaken for a final biological conclusion.
A practical checklist for a robust detection workflow
- Use age-matched controls and record developmental stage for every imaging batch.
- Fix acquisition settings, specimen orientation, timing, and temperature as far as the assay allows.
- Assess morphology and flow together instead of relying on a single screenshot.
- Retain source images and clips for every flagged sample.
- Validate automated thresholds against a manually reviewed reference set.
- Report uncertain calls separately from confirmed vascular abnormalities.
Conclusion
A Zebrafish Cardiovascular Analysis System is most useful when it supports a transparent chain of evidence: standardized imaging, control-aware measurements, reviewable outlier flags, and confirmation of meaningful patterns. With that approach, vascular abnormalities are detected not simply because software finds a difference, but because the difference remains consistent when imaging conditions, morphology, flow, and biological context are considered together.








