
 EN
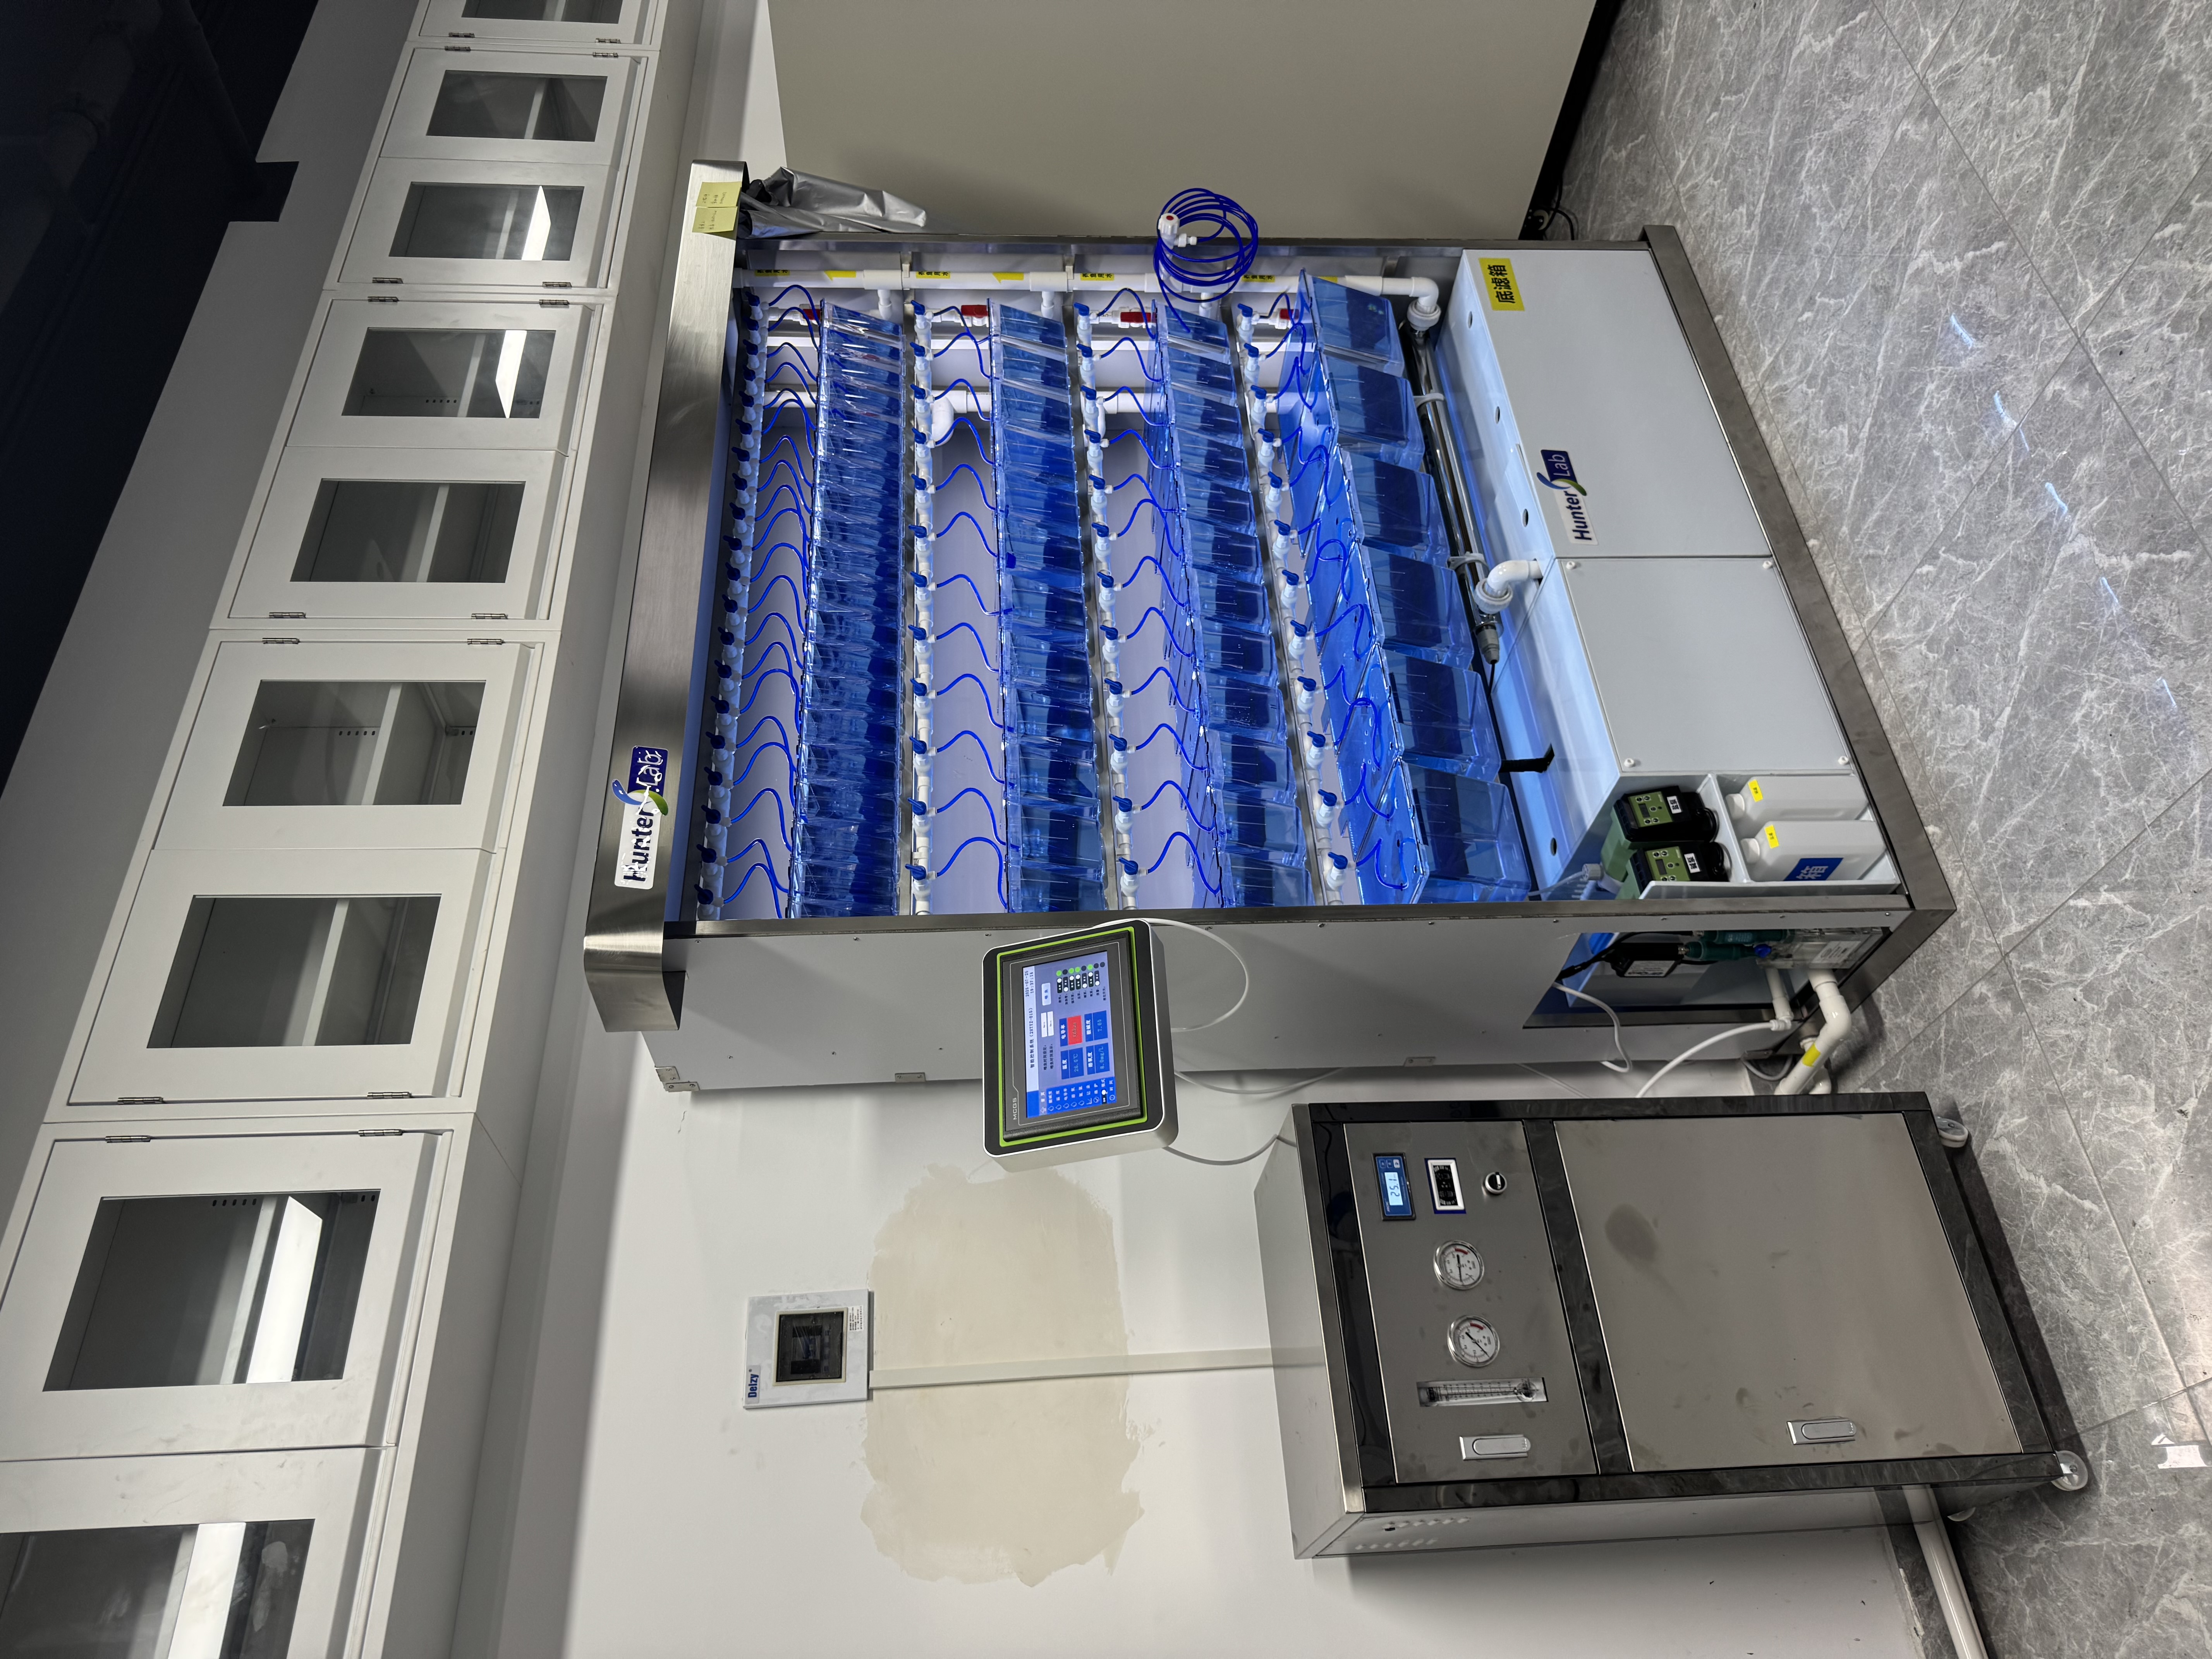
The real cost of manual water testing routines
Manual water testing looks cheap on paper. A test kit, a few reagents, and a few minutes per tank. In practice, the cost adds up fast. A facility with multiple racks and dozens of tanks has to sample, test, and log each one on a regular schedule. That schedule competes with feeding, cleaning, health checks, and actual research work. The hours add up quietly, and they rarely appear in any project budget.
The bigger problem is not the time itself. It is the variability. One technician tests at 9 a.m., another at 2 p.m. One measures pH carefully, another rushes through it. Over weeks, those small differences create a water quality record that is hard to trust. A zebrafish water quality monitor changes that picture by replacing many of the manual steps with continuous, automated measurement.
What a water quality monitor actually replaces
A monitoring system does not replace every manual test. It replaces the repetitive ones that dominate the schedule. Temperature, pH, conductivity, and dissolved oxygen are the usual candidates. Ammonia and nitrite may be monitored continuously in some systems or checked manually in others. The monitor samples from the sump or from representative tanks and logs the values automatically.
-
Continuous temperature tracking replaces daily thermometer checks.
-
pH and conductivity logging replaces routine handheld meter readings.
-
Dissolved oxygen monitoring replaces spot checks with a probe.
-
Automated data logs replace handwritten notebooks.
-
Alarm systems replace the need for someone to watch every reading.
What remains manual is usually the lower-frequency testing and the verification of sensor accuracy. That is a much smaller workload than the daily routine it replaces.
Where the time savings actually come from
The savings come from three places. The first is the testing itself. Instead of walking to each tank with a meter, the technician reads a dashboard. The second is the recording. Manual logs take time to write, transcribe, and file. Digital logs are automatic. The third is the follow-up. When a manual reading looks off, someone has to re-test to confirm. A continuous monitor shows whether the value is drifting or just a one-time blip.
| Task | Manual routine | With monitor |
|---|---|---|
| Daily temperature checks | Walk to each tank | Dashboard reading |
| pH and conductivity | Handheld meter, per tank | Continuous logging |
| Dissolved oxygen | Spot checks | Continuous |
| Record keeping | Handwritten, then transcribed | Automatic digital log |
| Re-testing outliers | Repeat the measurement | Trend review in software |
The combined effect is a large reduction in routine testing labor. The exact figure depends on tank count, testing frequency, and how the facility was organized before. For many facilities, the routine workload drops by a substantial margin, often leaving staff free for observation and animal care tasks that were previously rushed.
A field example from a facility that made the switch
A multi-rack facility in eastern China had been running manual water tests twice daily for years. The routine involved two technicians, a cart of meters and reagents, and a paper log that was transcribed into a spreadsheet at the end of each week. The transcription alone took several hours weekly.
After installing a continuous monitoring system, the daily routine changed. Technicians checked the dashboard in the morning, verified one or two readings with a handheld meter as a cross-check, and moved on to animal care. The paper log disappeared. The weekly transcription stopped. The time freed up was redirected to tank inspections and health checks that had often been squeezed into the end of the day.
The switch was not perfect. One sensor drifted within the first few months, and the team had to add a monthly calibration routine. That routine takes time, but it is far less than the daily testing it replaced. The net labor savings remained substantial.
Where the monitor still needs a human eye
Automation has limits. A monitor can tell you the pH is stable. It cannot tell you that a tank looks cloudy, that a fish is swimming oddly, or that a filter is making an unusual noise. Those observations still require a person walking the racks.
Sensor drift is another reality. A probe that reads accurately today may drift over weeks or months. Without periodic calibration, the data becomes unreliable. The monitoring system reduces manual testing, but it does not eliminate the need for maintenance and verification.
There is also the question of what to do with the data. A continuous log produces a lot of numbers. Someone has to review the trends and decide whether a slow shift in conductivity is meaningful or just noise. The monitor provides the information. The interpretation still belongs to the staff.
Getting the most from a monitoring investment
The savings from a water quality monitor depend on how well it is integrated into the daily routine. A system that logs data but nobody checks is not saving much. A system that triggers alarms, feeds a dashboard, and replaces the manual log is a different story.
It also helps to start with the parameters that matter most and expand from there. Temperature and dissolved oxygen are usually the first priorities. pH and conductivity follow. Ammonia monitoring may come later, depending on the facility's filtration design and stocking density.
Finally, it is worth documenting the before-and-after workload. A simple time study before installation and again a few months later gives the facility a real number to work with. That number is more useful than any vendor estimate.
Hunter Lab (Hunter) builds zebrafish laboratory equipment with attention to the reliability that continuous monitoring depends on. The manufacturing and quality control side supports the sensor stability and system consistency that long-term colony management requires. For facilities weighing a monitoring upgrade, that kind of build discipline is part of the foundation.








